This feature comes as part of our ongoing commitment to enhancing our services and providing even more value to our customers. We understand the importance of detailed and customisable reports for educational institutions.
With our new report-building feature, you'll have the power to:
⭐ Generate custom reports based on your specific requirements
⭐ Access a wide range of data points and metrics
⭐ Create insightful and visually appealing reports with ease
⭐ Save time and effort with streamlined processes
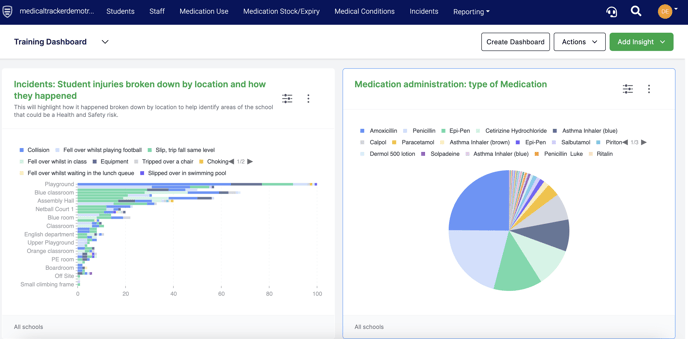
Below is a snapshot of the new dashboard:
Customising your new dashboards
Creating a dashboard
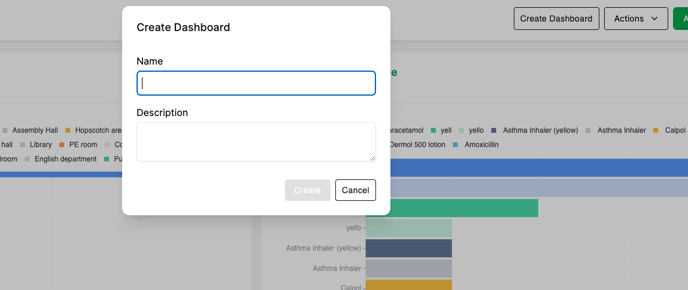
You can create multiple dashboards to group different insights together. To create a new dashboard, go to 'Create Dashboard', enter the name and description and click 'Create':
You can also choose which dashboard will be your default view - go to 'Actions' and choose 'Save as default dashboard'. In this menu, you can also edit the name and description of a dashboard, or delete it.
The types and variations of the insights are limitless - you can create reports based on any data which is stored on your Medical Tracker account. Please read on to learn how to add and create insights to your dashboard.
Insights and reporting
Adding an insight
Click on the green 'Add Insight' button - here, you can choose from an existing insight list, or create an insight from scratch. Choosing a ready-made insight means you will have an instant report to view and can then change the filters and display as required.
Let's look at creating an insight. Click 'Create new insight' - first, add a header and summary in the top-left corner:
Now we're going to work through the options on the right-hand side. Here, if you are using a multi-academy trust account, you can choose which schools to include (all will be included by default).
Next, you can choose which primary source of data to use in the report (e.g. incidents, medical conditions etc). There is also the option to select additional data if required.
Under Filters, you can add any number of filters - for example, if you only wish to include incidents after a specific date. The default incident date will be starting from the current academic year.
In Chart Settings, you can choose how to display the data and which dimensions to include from the primary data source. In the below example, I want to display the data from the 'How it Happened' field with a breakdown by year group in a bar chart - and it has generated a preview:
Click 'Create' and your new insight will show on your dashboard!
Once an insight has been added or created, you can adjust the display and filters as required.
Exporting an insight
To export a report, click on the three dots in the top-right corner of the insight, and select 'Export Data'. Please note, this exports to a .csv file which can be viewed as a spreadsheet. You can recreate a bar or pie chart by inserting a pivot table and changing the display options (this guide demonstrates how to create a pivot table on MS Excel ).
If you are part of a multi-academy trust, you can standardise most drop-down lists in Medical Tracker in order to create accurate reports across all sites - please see this guide for more information: Configuring the settings for your Trust account